
METATRADER 4 - THE SIMPLEST AND ONE OF BEST INDICATOR TO USE
THE SIMPLEST AND ONE OF BEST INDICATOR TO USE ON METATRADER 4
I understand how frustrating it is to stare at your phone or laptop watching and noting the bullish and bearish movement of the chat. You don't need to worry yourself about whether you enter a trade at the right time as I am going to be telling you the two best indicators you can use, this indicator is sure to give you an 85% rate of winning your trade if applied very well.
RSI - Relative Strenght Index
This is the commonest indicator you can follow as a beginner as shows you the right time to enter a trade and the right time to close it if studied well.
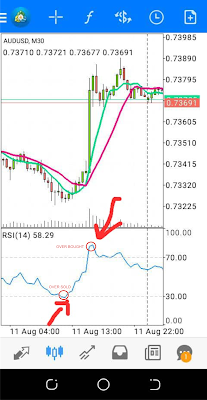
When the chart is experiencing a bearish trend and it enters oversold that is the best time for you to buy because it is likely that the next trend the chart will experience after that is the bullish trend. Also when the market is experiencing a bullish trend and it enters an overbought region then you sell because the next trend after that will be bearish. Example below


Comments